
One of the oldest HFT alphas
High frequency trading is relatively new. However, some of the concepts used have been around for quite some time

The best alphas are usually the ones backed up by common sense. If I tell you that a buy order will probably push the price higher and a sell order lower you wouldn't be surprised. And if you are surprised, imagine you own an ice cream cart and notice a big inflow of people trying to buy your ice creams, you may want to consider increasing your prices. That’s the basics of supply and demand.
So how can you use this common sense in trading? A good first step might be starting with a hypothesis “I believe demand will push prices up, the more demand, the more the price will increase”. Where can you observe demand in trading? You can start looking into the order flow.
Luckily, order flow is a very old and researched topic. Back in 1991, Joel Hasbrouck published “Measuring the information content of Stock Trades”. Some of his main findings were:
The price impact of a trade is not instantaneous.
The bigger the quantity of a trade, the bigger the impact.
Market makers widen their quotes in response to large trades.
Price impact is larger in markets where the spread is wide and less liquid.
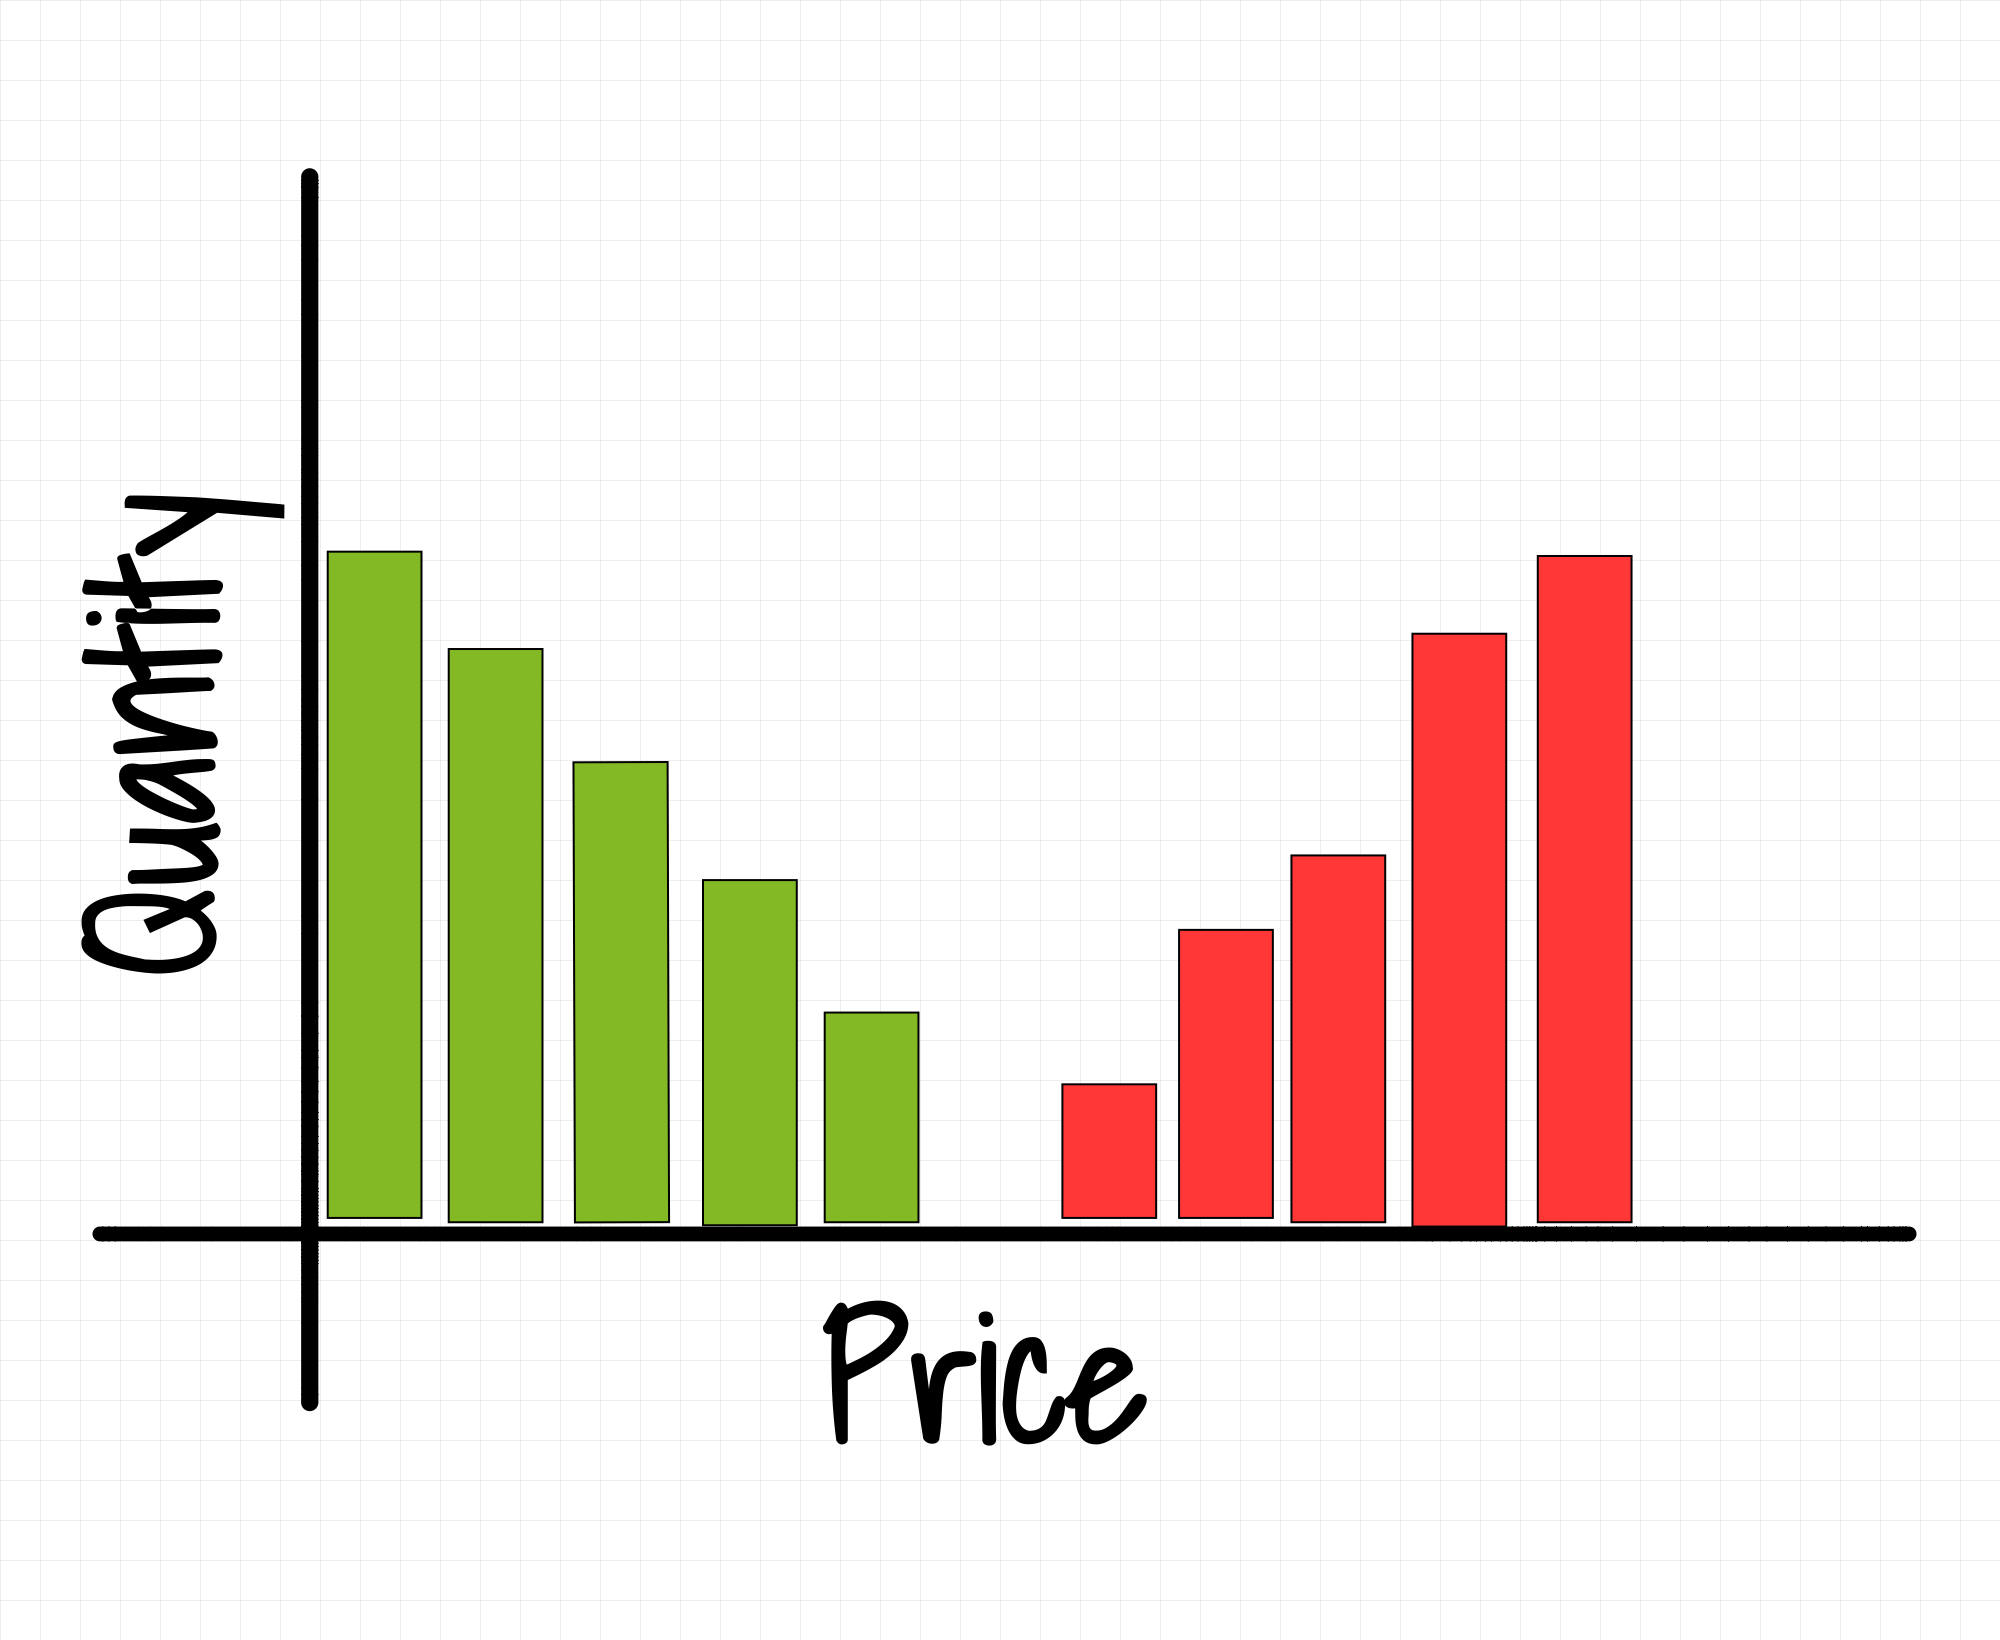
This opens the doors to many potential ideas a naive trader may want to explore. Specially about the first two points above, someone could think that a trade with a volume Q will move on average the price by a ratio proportional to Q. And the idea may not be bad at all! If the order book shape looked like the following picture:

But do the order books you see in the market look like that? Go check any order book that has at least two or three levels on each side, it can be crypto, equities, forex, options, futures… Pretty sure you will see the following “V” shape.
Square-root law
It wasn’t just you the one that noticed the actual shape of the order books. Dozens of independent researchers published numerous papers arriving at the conclusion that the impact of a trade with a volume Q is closer to √Q than to Q, specifically:
Where:
I = Impact of a trade, or the difference in price between the times before and after the trade was executed.
σ = volatility.
Q = quantity of the order.
V = traded volume.
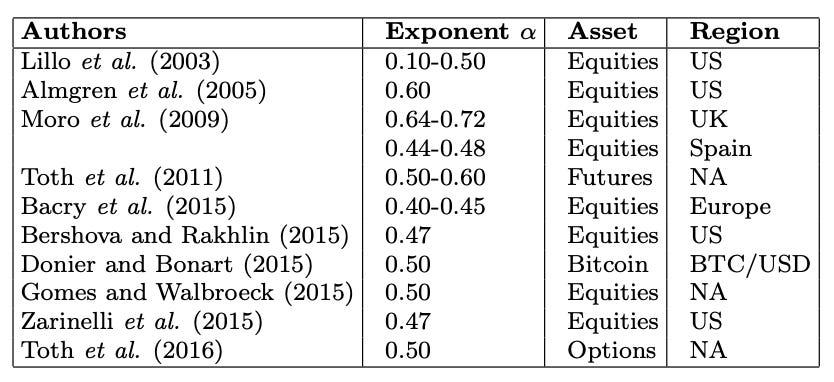
Why the square root? Let’s rewrite the formula above using power law such as:
Setting α = 0.5 would give us the same formula as above. Capponi and Cont compare in their “Trade duration, volatility and market impact” paper, the numerous studies investigating variations of the generalized formula, can observe all of them oscillate around α = 0.5.
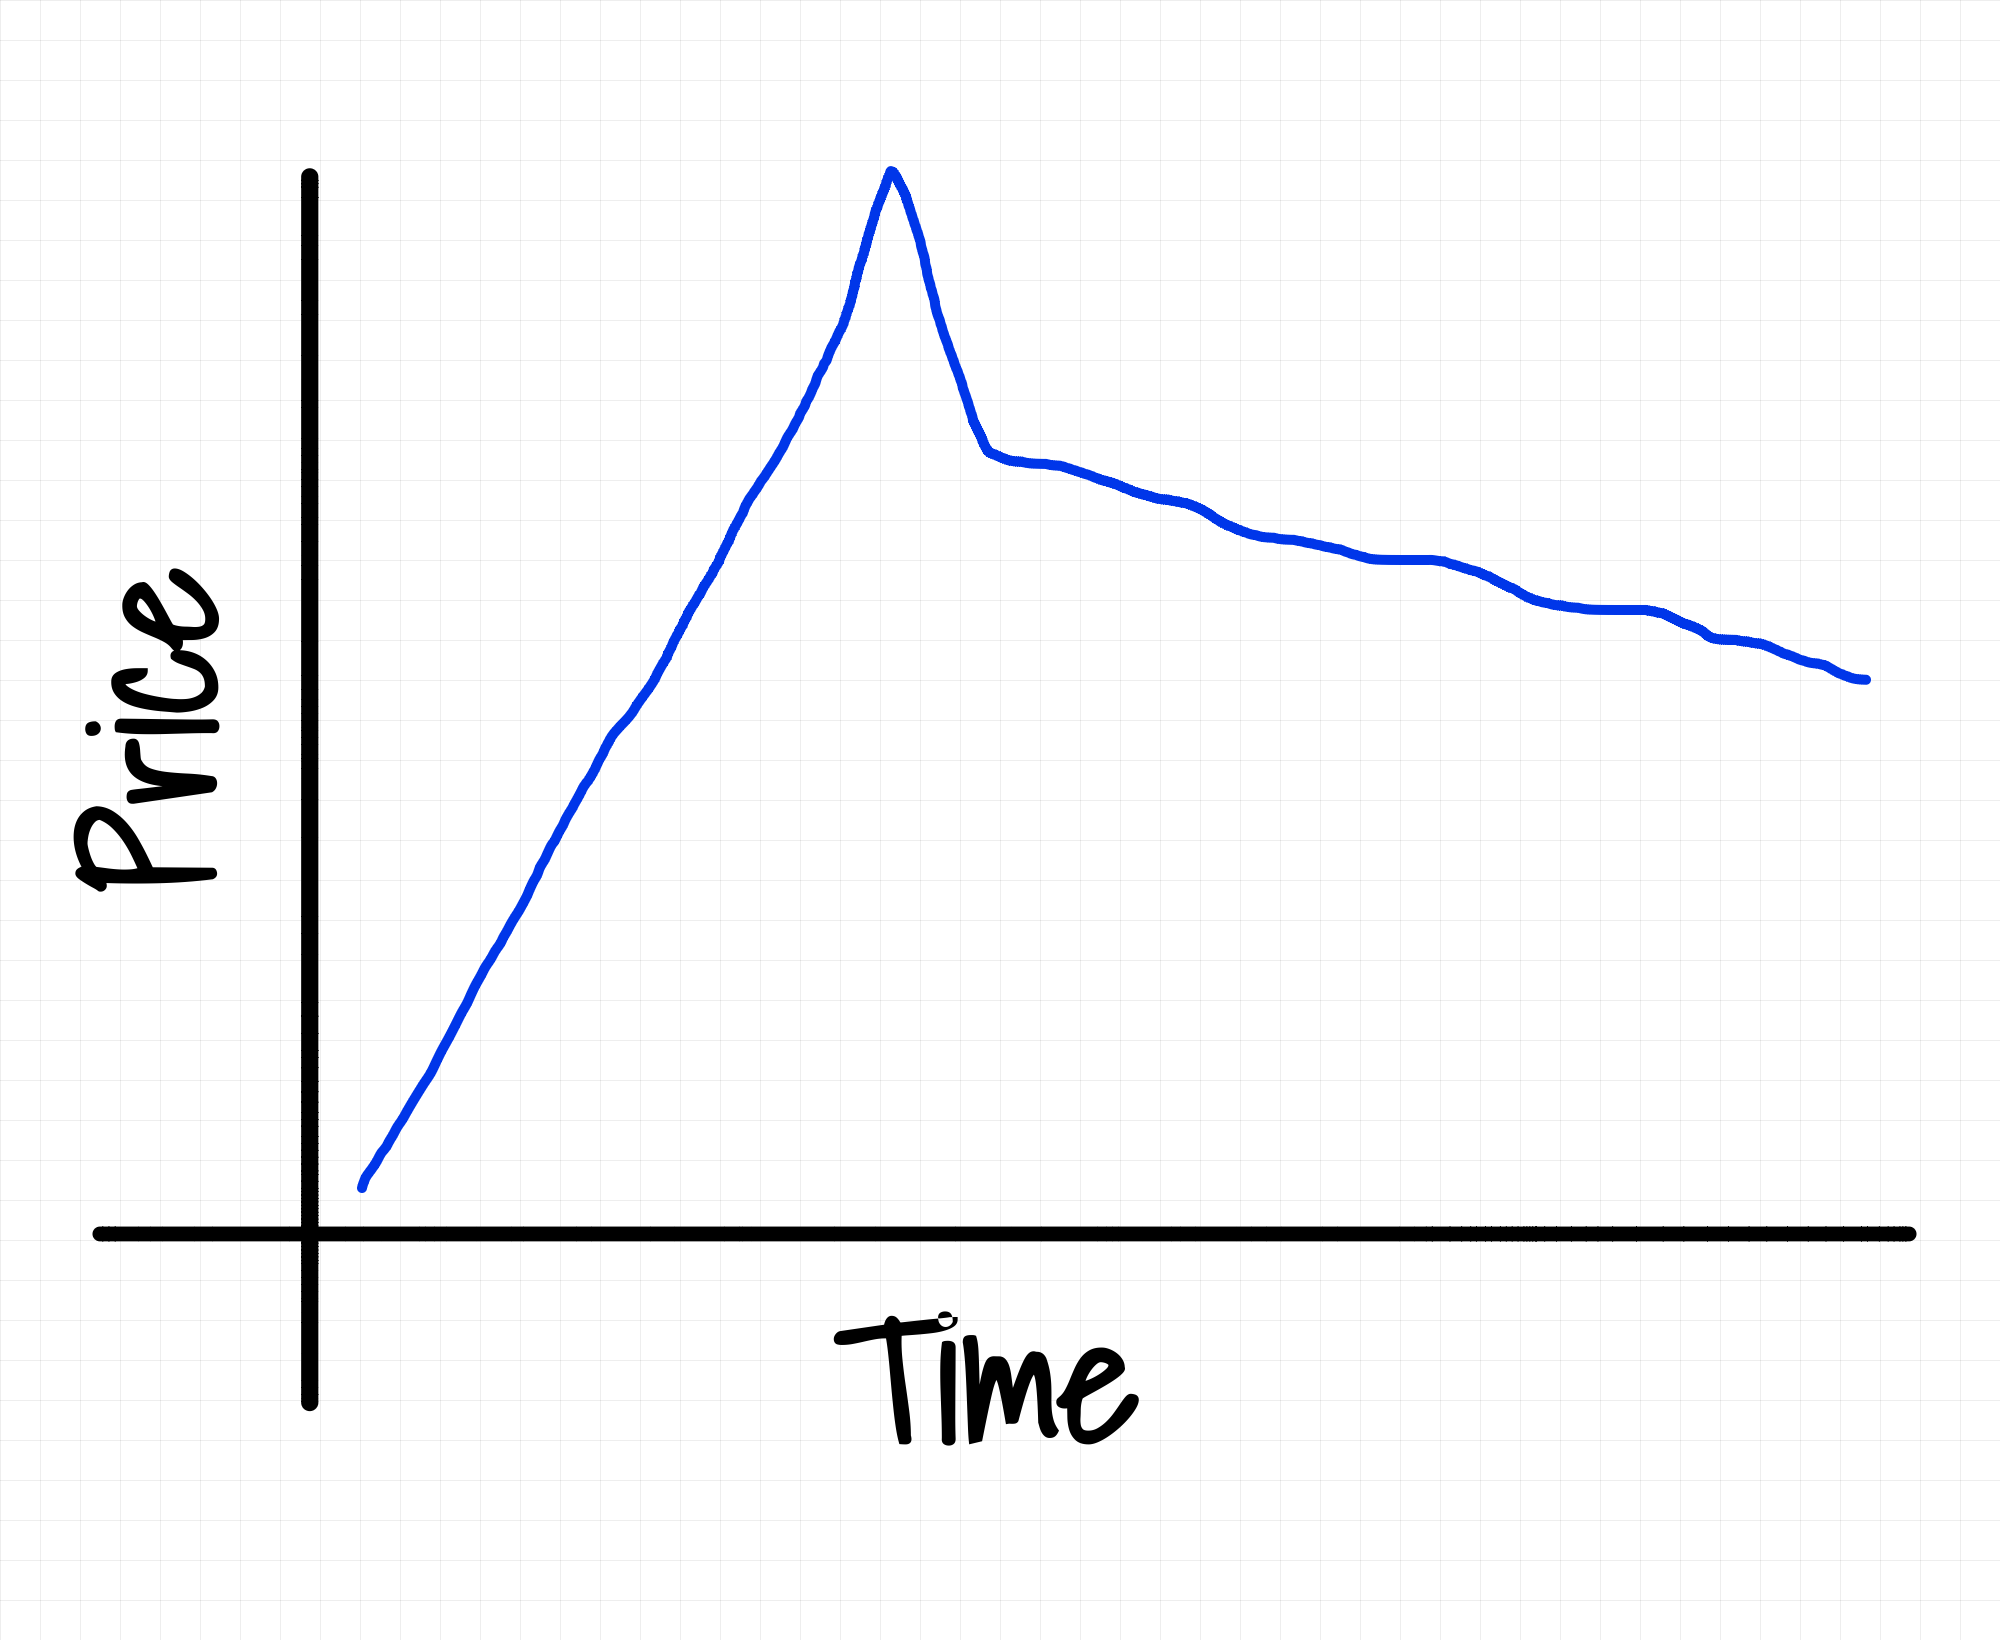
Back to the hypothesis that we formulated at the beginning: “I believe demand will push prices up, the more demand, the more the price will increase”. Is it supported by the evidence we provided? Sort of… It’s obvious that a $1mln trade will have more impact than a $100 one. But because the order books are not flat, the relationship is not linear. The impact would actually look something like this:

I recommend reading all the market impact research published by Jean-Philippe Bouchaud. In one of his most interesting papers, “Anomalous impact in reaction-diffusion models”, he compares the square-root model to a reaction-diffusion model, quoting him:
where two types of particles (called B and A), representing in a financial context the intended orders to buy (bid) and to sell (ask) diffuse on a line and disappear whenever they meet, corresponding to a transaction. This highly stylized model can be argued to capture the essential features of the liquidity dynamics in financial markets, at least on long enough time scales where the precise microscopic details of the model become irrelevant.
Lastly, it’s worth noting that the generalized formula only considers the size of the trade relative to the daily volume and does not consider, among others, things like:
How the trade was executed
Slicing and/or rate at which the trade was executed
Market cap
How can you use it in HFT
The market impact has an instantaneous effect and a laggy one. The laggy one could be attributed to herding behaviour and copy-cats. After a trade has been executed the impact decays around 30%.
A way to implement the square-root law (or rather market impact effect) in HFT would be to measure trades of the last second to forecast where the price will be in the next second. This way you will be able to update your fair price and quotes to account for that impact.
In the HFT world, the effect still persists nowadays. How you capture it — make an alpha out of it — is another story. Here are some questions that may help you along:
How correlated are trades measured by this square-root law with future returns?
Is the impact of the trade I’m measuring part of a metaorder? — A metaorder is a parent order that gets sliced into smaller ones.
Would it be fair to apply the square-root law for small orders that don’t sweep the order book?
Are there any ways I can classify trades into informed and uninformed? Maybe informed trades impact have more impact?
I’m open to any constructive feedback, so please reach out to me if you have any ideas or things I didn’t cover! You can find me on X @ninjaquant_
Always remember that the “alpha” is in the trader, not in the “alpha” itself.
- Me
Looks good